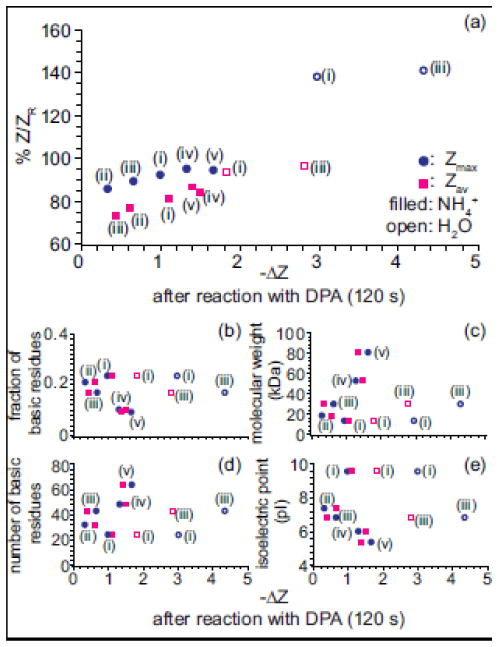
Figure 5.
(a) The percent Zmax (circle) and Zav (square) of ZR, for protein ions formed from aqueous ammonium acetate (filled markers) or pure water (open markers) prior to reaction with a base v. the decrease in Zmax (circle) and Zav (square) after 120 s reaction with DPA. (b) fraction of basic residues, (c) molecular weight (d) number of basic residues (e) isoelectric point (pI) for each protein as a function of the decrease in Zmax (circle) and Zav (square) after 120 s reaction with DPA. (i) corresponds to cytochrome c, (ii) myoglobin, (iii) carbonic anhydrase, (iv) concanavalin A dimer and (v) holo-transferrin ions, respectively.

