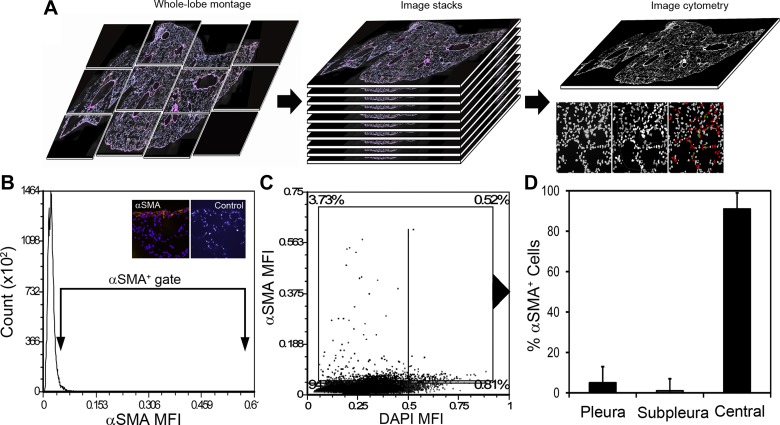
Fig. 1.
α-SMA+ cell distribution in the murine lung. A: tissue sections of the murine lung were stained with a nuclear intercalation dye (Hoechst or DAPI) as well as primary anti-SMA rabbit polyclonal antibody followed by fluorescent anti-rabbit detection antibody. Whole-lobe montages were created of the cardiac lobe for subsequent segmentation and image cytometry. B: paired tissue samples, stained with the detection antibody alone or purified rabbit IgG, served as negative controls (B, inset). C: the cells were displayed on a dot plot reflecting SMA and DAPI mean fluorescence intensity (MFI). Quadrant percentages are shown in the plot corners. D: the SMA+ cells were gated and the corresponding cells localized in the tissue image. Most of the SMA+ cells were localized to the central regions of the lung corresponding to large airways and blood vessels. Less than 5% localized to the pleura and less than 1% to subpleural regions of the lung. Areas of atelectasis or gross inflammation were excluded from the analysis. N = 7 mice; mean number of cells per montage = 1.53 × 10⁵ cells.

