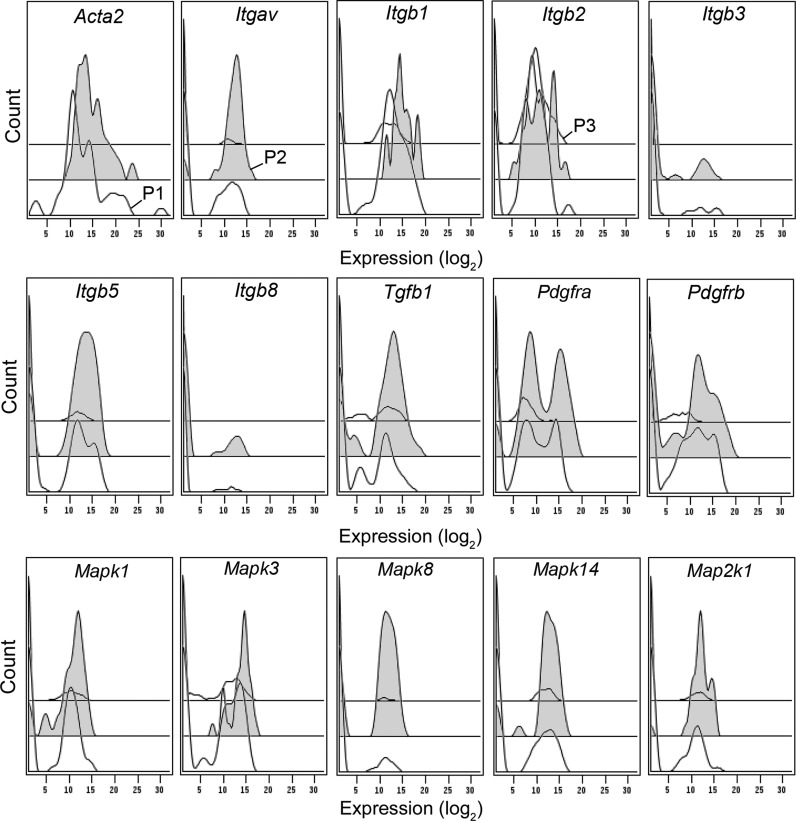
Fig. 5.
Tiered gene expression histograms of the transcriptional profile of cells isolated from alveolar ducts. Because of the transcriptional profile statistical identity on POD 1, POD 3, and POD 7, aggregate data is shown. The high transcriptional activity population (designated P2 and colored gray) is bracketed by the low transcriptional activity population (P1) and all Acta2− cells (P3). The majority of the Acta2+ cells in P2 coexpressed Itgav, Itgb1, and Itgb2. As expected, the P2 cells expressed high levels of Tgfb signaling molecules. Notably, Mapk expression was significantly higher in P2 than P1.

