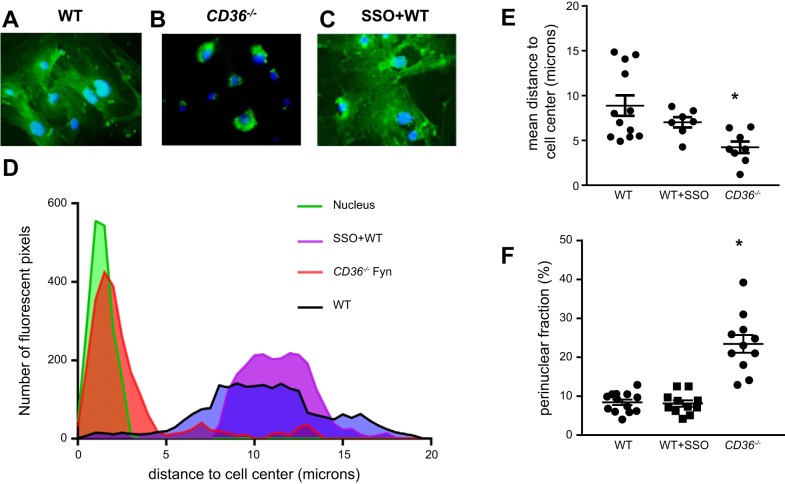
Fig. 4.
Subcellular localization of Fyn in CD36−/− MLMVEC. Representative immunofluorescence images of WT (A), CD36−/− (B), and SSO-treated WT (C) MLMVEC stained with anti-Fyn antibody (green) and nuclear counterstain (DAPI; blue). D: representative histograms showing distance of fluorescent pixels from the center of the cell nucleus in WT CD36−/− and SSO-treated MLMVEC. E: scatterplot showing mean ± SE distance from nucleus in WT, SSO-treated, and CD36−/− MLMVEC for the histogram shown in D. F: scatterplot showing mean ± SE perinuclear fraction in WT, SSO-treated, and CD36−/− MLMVEC. *Significant difference from WT; n = 3 independent experiments, consisting of 7–12 images for each condition.

