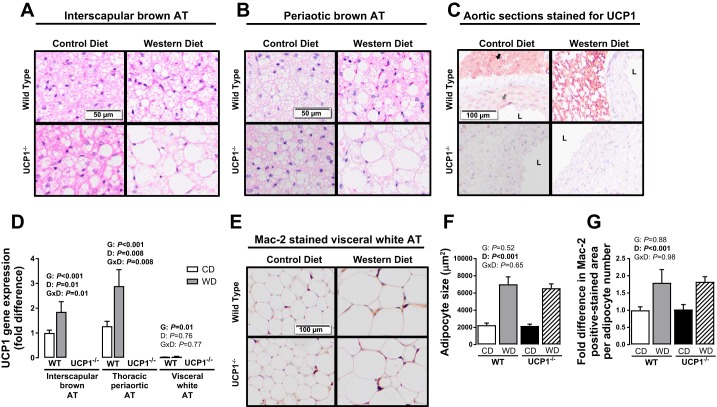
Fig. 2.
Interscapular brown (A) and thoracic periaortic (B) AT representative histology images (×20) and histology images (×10) of aortic sections and adjacent periaortic AT stained for UCP1 identified as the maroon color (C). D: UCP1 expression in the designated ATs. E: histology images (×10) of visceral white perigonadal AT stained for Mac-2. Average adipocyte size (F) and fold differences in Mac-2 positive stained area in WT and UCP1−/− mice fed a control diet vs. Western diet (G). Data are expressed as means ± SE. Black arrow indicates strongly positive immunoreactivity of UCP1 in periaortic AT. Gray arrow indicates faintly positive immunoreactivity of UCP1 in the media of the aortic wall. Positive staining for UCP1 is absent in the UCP1−/− mice. WT, wild-type; CD, control diet; WD, Western diet; D, main effect of diet; G, main effect of genotype; DxG, diet by genotype interaction. Significant P values (≤0.05) are highlighted in bold; n = 9–14 per group.

