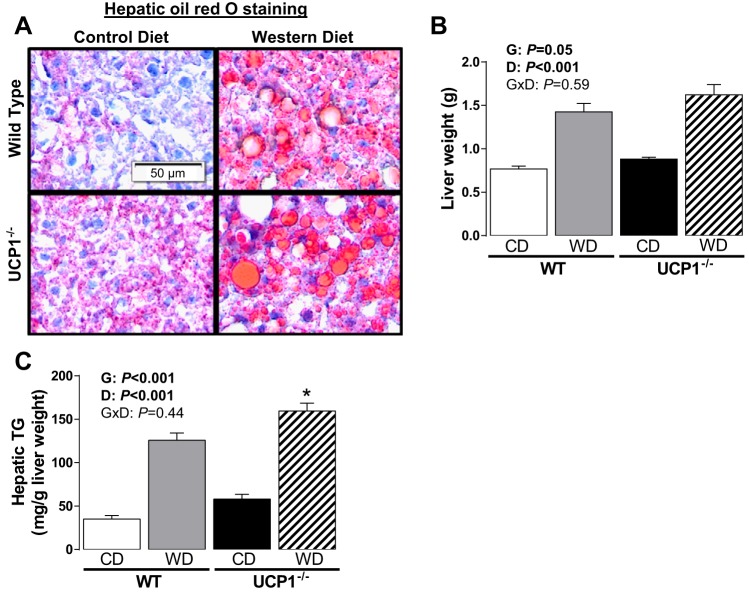
Fig. 4.
Representative histology images (×20) of oil red O-stained liver (A), liver weight (B), and hepatic triglycerides (C) in WT and UCP1−/− mice fed a control diet vs. Western diet. Data are expressed as means ± SE. No significant interactions were found. Significant P values (≤0.05) are highlighted in bold. *P < 0.05 vs. all groups; n = 9–14 per group.

