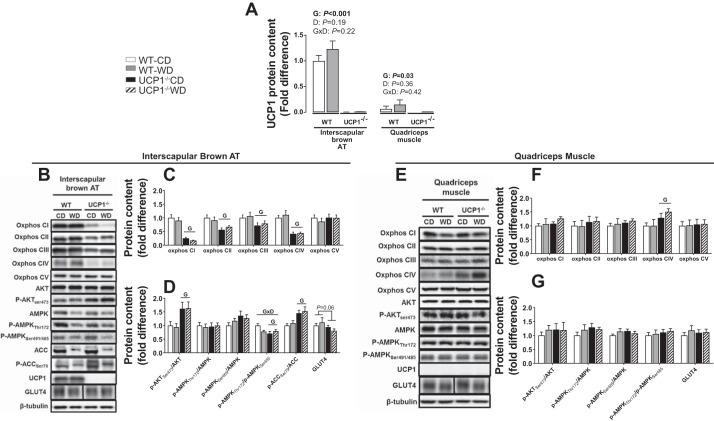
Fig. 6.
Interscapular brown AT (A–D) and muscle protein content (A, B, E, F). A: UCP1 protein content (A), oxphos protein (C, E), Akt, AMPK, and GLUT4 protein (D, F) in WT and UCP1−/− mice fed a control diet vs. Western diet. Blots were normalized to β-tubulin. B: one representative β-tubulin blot is presented. p-Akt, and p-AMPK, p-ACC were normalized to total Akt, AMPK, and ACC, respectively. Protein levels are expressed as fold change (means ± SE) to the wild-type control diet group, which was set at 1. A: protein levels are expressed as fold change (means ± SE) to interscapular brown AT wild-type control diet group (i.e., 1). Representative bands for GLUT4 were obtained from the same gel but are noncontiguous, as denoted by separation with a black line. Significant P values (≤0.05) are highlighted in bold. (n = 9–13 per group).

