
Fig. 6.
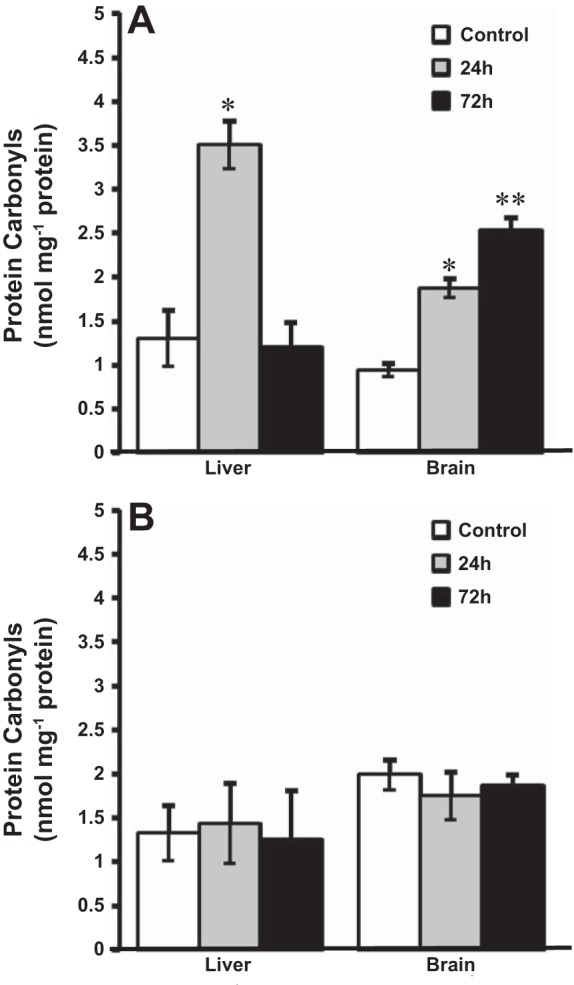
Level of protein carbonyls in tissues of goldfish exposed to acute ammonia toxicity (measured ammonia = 5.3 mmol/l) at 14°C (A) and 4°C (B). Data are presented as means ± SE (n = 6–8). *Statistically significant differences from the corresponding control groups or **24-h treatment groups as assessed by ANOVA followed by Tukey-Kramer posttest, P < 0.05.