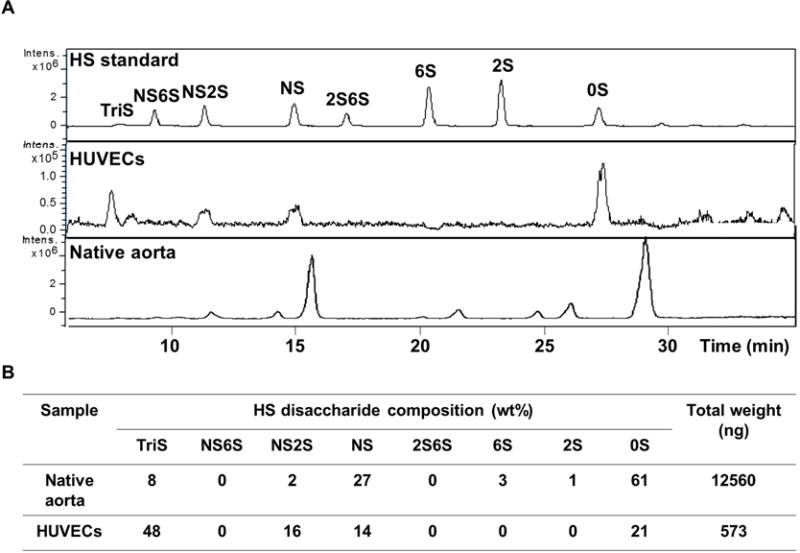
Figure 5. LC-MS quantification of HS content on rat aorta and HUVEC monolayer surfaces.

(A) Representative extracted-ion chromatogram of HS disaccharide standard, HUVEC monolayer (1 cm2 surface area) and native rat aorta (1 cm2 surface area). (B) Quantification of HS disaccharide composition. The results are mean of five independent assays using five different rats and HUVEC culture (n=5).
