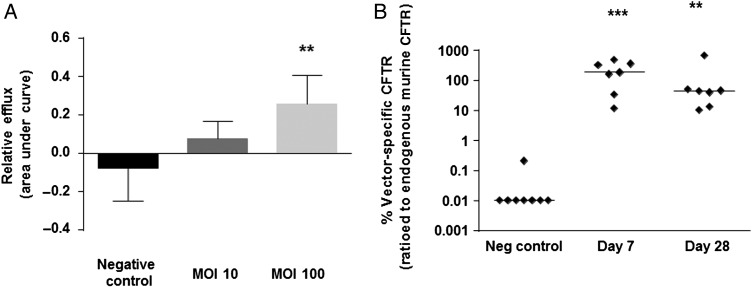
Figure 6.
Confirmation of CFTR expression and function. (A) HEK293T cells were transfected with rSIV.F/HN-hCEF-CFTR or an irrelevant control virus (negative control) at MOIs of 10 and 100. The iodide efflux assay was performed 2 days after transduction. Data are presented as mean±SEM. **p<0.05 compared with negative control (ANOVA followed by Dunnett's multiple comparison test). (B) Cystic fibrosis knockout mice were transduced with rSIV.F/HN-hCEF-CFTR (1.6E8 TU/mouse) by nasal instillation. Negative controls were treated with PBS (n=7–8/group). Mice were culled 7 and 28 days after vector administration and vector-specific mRNA was quantified in the lungs. Each symbol represents one animal. The horizontal bar shows the group median. The dotted line indicates the detection limit of the assay. ***p<0.005 and **p<0.01 compared with the negative control (Kruskal-Wallis followed by Dunn's multiple comparison test).

