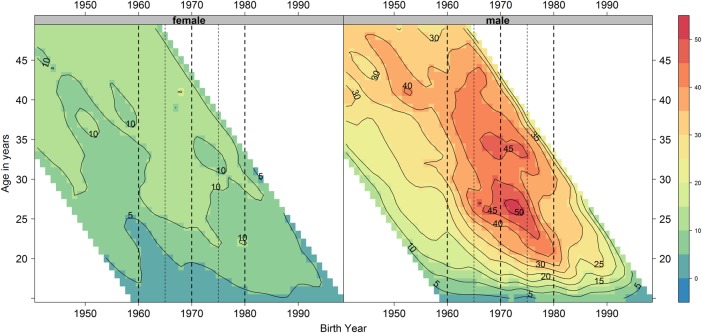
Figure 1.
Smoothed shaded contour plot of age-year specific crude suicide rates per 100 000 population in Scotland for each single age from 15 to 49 years of age and each birth year from 1940 to 1998 stratified by sex. The colour and contour labels indicate the number of suicides per 100 000 for each single age and year. Thick dashed guidelines indicate birth cohorts 1960 (left most line), 1970 and 1980 (right most line) and thinner ones mid-decadal birth cohorts 1965 and 1975.

