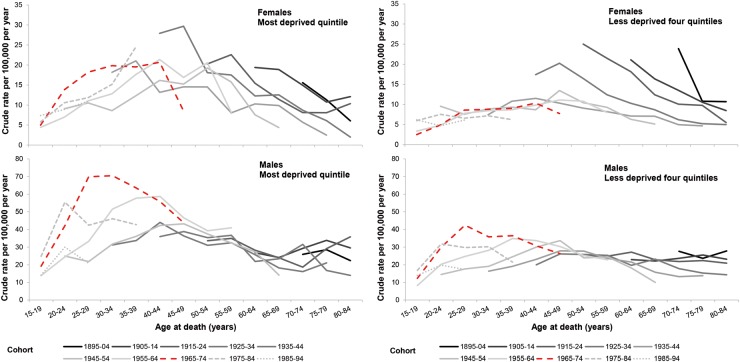
Figure 3.
Crude suicide rate per 100 000 population per year in Scotland by age (5-year age groups, for ages 15–84 years), birth cohort (10-year cohorts 1895–1994), sex and deprivation. The 1965–1974 cohort identified from shaded contour plots as that most affected by a cohort effect is identified in red and large dashes.

