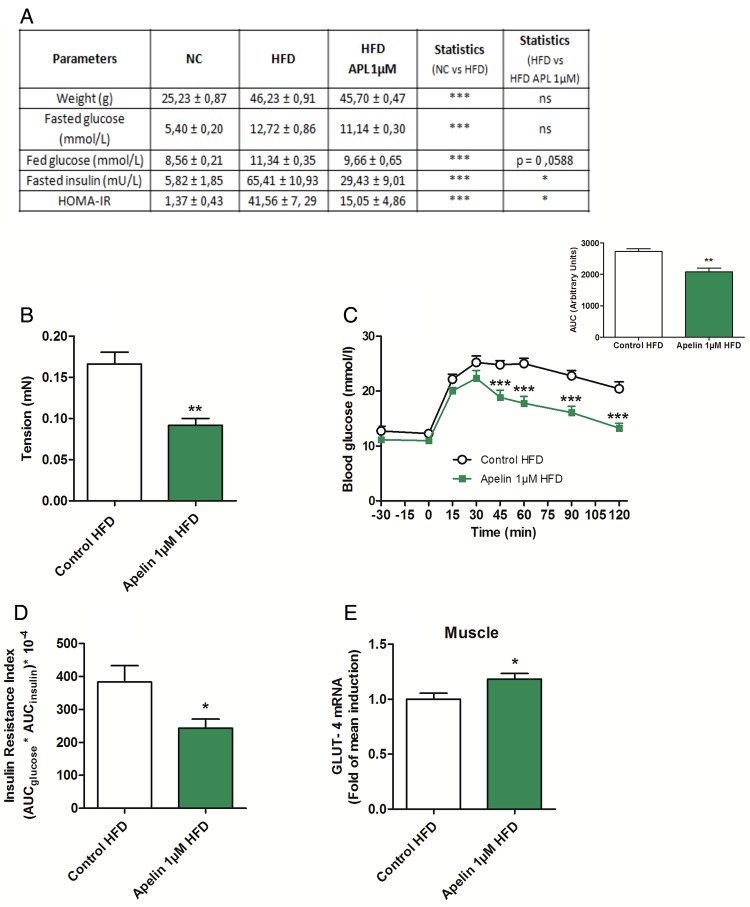
Figure 8.
Apelin 1 µM treatment increases glucose tolerance via a decrease in duodenal contractility. (A) Effects of high-fat diet (HFD) on metabolic parameters in mice orally gavaged for 1 week with H2O (Control HFD) or apelin 1 µM. n=6 per group. (B) Ex vivo measurement of duodenal mechanical contraction in HFD mice orally gavaged for 1 week with H2O (Control HFD) or apelin 1 µM. n=6 per group. **p<0.01 vs Control HFD. (C) Oral glucose tolerance test (OGTT) in 6 h fasted HFD mice, orally gavaged for 1 week with H2O (Control HFD) or apelin 1 µM. n=6 per group. **p<0.01, ***p<0.001 vs Control HFD. The adjacent graph represents the average area under the curve (AUC). (D) OGTT-associated insulin resistance index in 6 h fasted HFD mice, orally gavaged for 1 week with H2O (Control HFD) or apelin 1 µM. n=6 per group. *p<0.05 vs Control HFD. (E) Relative expression of glucose transporter type 4 (GLUT-4) mRNA in muscle of HFD mice orally gavaged for 1 week with H2O (Control HFD) or apelin 1 µM. n=9–10 per group. *p<0.05 vs Control. HOMA-IR, homeostasis model assessment insulin resistance; NC, normal chow.

