Fig. 2.

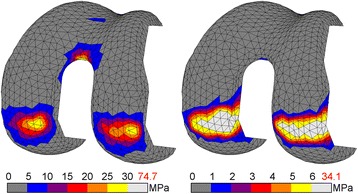
Compressive stress for CoCr (l) and PEEK (r) femoral component. Stresses exceeding 5% of respective yield stress (600 MPa vs. 117 MPa) are coloured white, with the peak stress depicted in red

Compressive stress for CoCr (l) and PEEK (r) femoral component. Stresses exceeding 5% of respective yield stress (600 MPa vs. 117 MPa) are coloured white, with the peak stress depicted in red