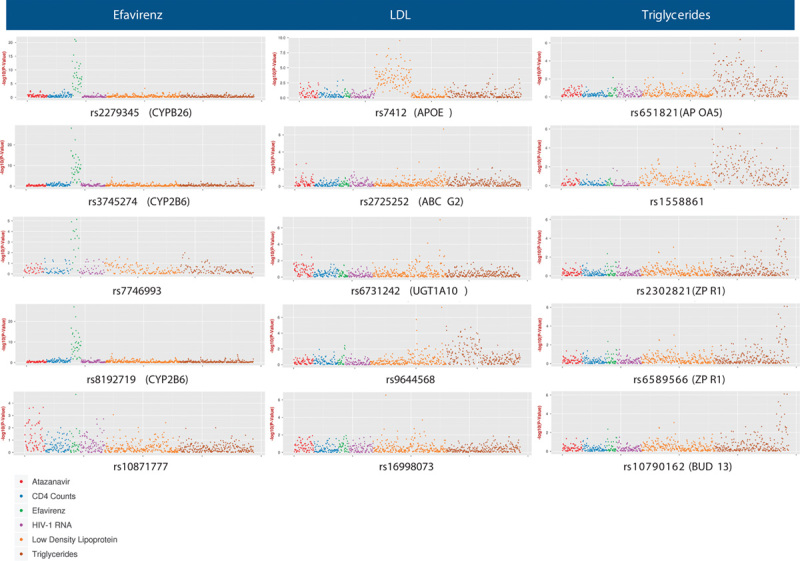
Fig. 2.

Manhattan plots representing all phenotype associations for the five single nucleotide polymorphisms (SNPs) with the lowest P-values for efavirenz pharmacokinetic, fasting low-density lipoprotein (LDL) cholesterol, and fasting triglyceride phenotypes. We analyzed SNPs that were annotated previously for any drug in the PharmGKB or associated previously with any trait in the GWAS Catalog, and that were also represented in the imputed, post-QC genome-wide data. Each marker represents, for each phenotype, the –log10 P-value for association with the indicated SNP. Color-coded phenotype categories are indicated at bottom left of figure. Note that the scale of the Y-axis differs between plots.
