FIGURE 7.
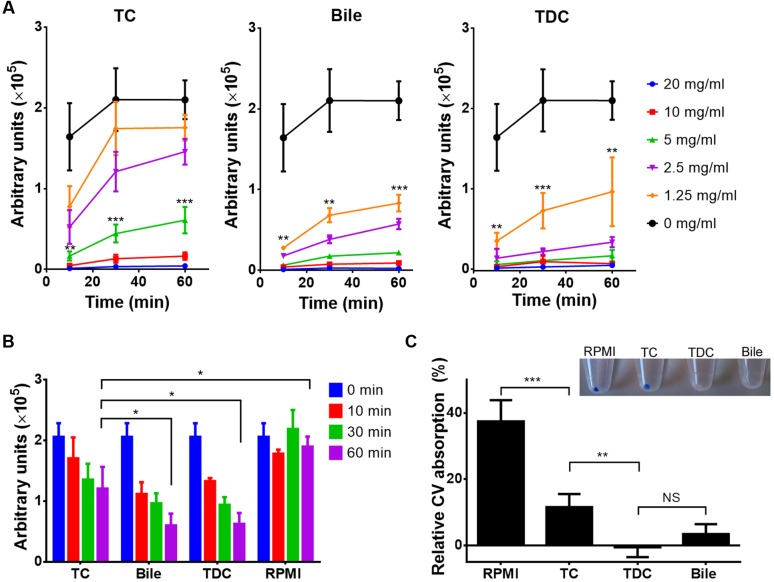
Uptake and efflux of rhodamine 6G and crystal violet (CV) in the presence of bile or conjugated bile salts. All data represent mean values + SD from three independent experiments. The Student’s t-test was used for calculation of statistical significance (∗p < 0.05, ∗∗p < 0.01, ∗∗∗p < 0.005, NS = not significant). (A) Time-dependent rhodamine 6G (R6G) uptake by C. albicans cells in the presence of serial dilutions of either taurocholate (TC), bile or taurodeoxycholate (TDC). Cells were harvested at indicated time points, washed and OD600-normalized R6G fluorescence was measured. Low fluorescence indicates low R6G absorption. Curves with asterisks indicate concentrations of TC (5 mg/ml), bile (1.25 mg/ml), and TDC (1.25 mg/ml) at which absorption significantly differs from the control. (B) R6G efflux assay. Yeast cells were pre-loaded with 1 μM R6G and shifted to R6G-containing media containing a fixed concentration (5 mg/ml) of either TC, bile or TDC. Efflux in presence of bile or TDC is significantly faster than with TC. (C) CV absorption by C. albicans in the presence or absence of 5 mg/ml of TC, TDC or bile. Inlay shows cell pellets after 30 min incubation with 2 μg/ml CV. The bar diagram shows the relative CV absorption from culture supernatants after 30 min of incubation in the presence of 4 μg/ml CV.

