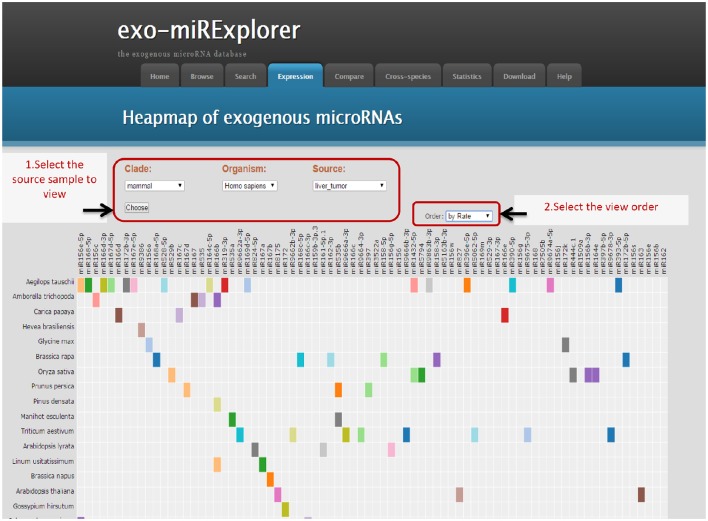
Figure 2.
Illustrative screenshots of the dynamic heatmap browser. The heatmap browser provides the exogenous species, microRNA families and frequency information of all the exo-miRNAs from a specific source. Users can change the selection box at top-left for clade, organism and special tissues, or cell lines; then, Exo-miRExplorer generates a dynamic heatmap graph. As shown here, most of the grids are gray, which indicates that no miRNAs were detected. The prominent color grid represents the particular microRNA that is detected, and the different color represents the “frequency value” of the miRNAs. Users simply click on the color grid, which links to provide details regarding miRBase to see details of these miRNAs. There are three manners to order these exo-miRNAs: By “frequency value”, by miRNA names, or by species names. Each manner can be chosen by changing the select box at the top-right.

