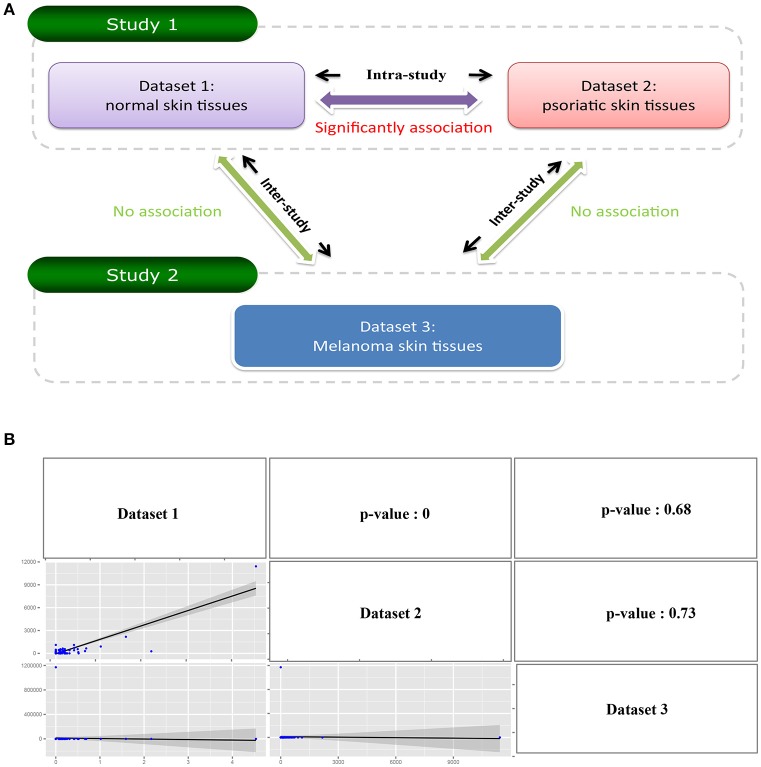
Figure 3.
Illustrate comparative investigation of exo-miRNAs between intra-study and inter-study. (A) Diagram of the relationship between three datasets. Dataset 1 and Dataset 2 belongs to the same study (study 1), and Dataset 3 belongs to the other study (study 2). The comparison between Dataset 1 and Dataset 2 is “Intra-study” analysis while the comparison between Dataset 1 with Dataset 3 or Dataset 2 with Dataset 3 is “inter-study” analysis. (B) The result of the comparative analysis. The figure contains a matrix with nine grids. The strings on diagonal represent the corresponding row names and column names of the matrix. The figures on the lower triangle are the pairwise relations between the row name and column name where they located, and the upper triangle is the corresponding p-value of the pairwise comparison.

