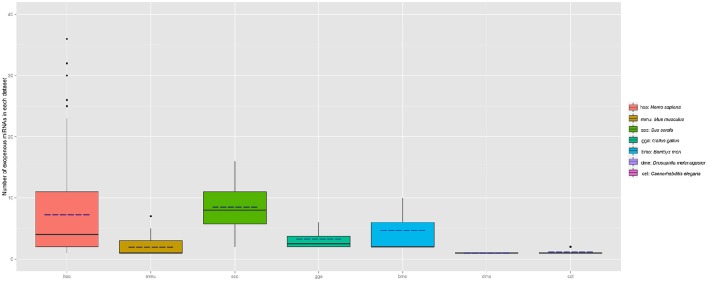
Figure 4.
Distribution of plant miRNAnumber in each species (sample number >3). The number of exo-miRNA in each dataset is calculated and grouped by different species. Boxplot is used to illustrate the distribution of exo-miRNA number in each species, the solid line represents the medium number of exo-miRNA in each species, the dotted line represents the mean value of exo-miRNA.

