Figure 9.
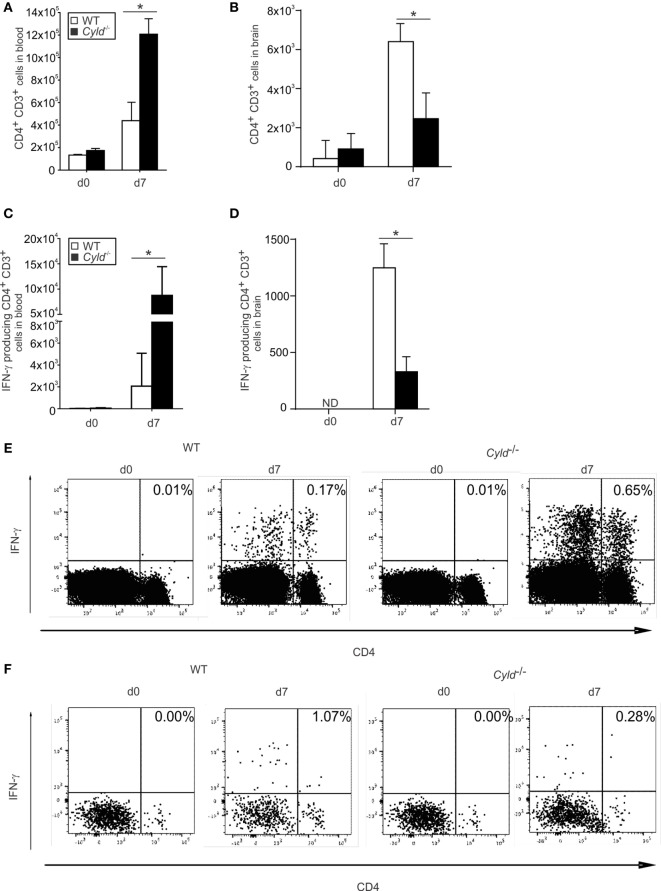
CD4+ T cell responses increase in the blood and decrease in the brain of Cyld−/− mice. (A,B) Total numbers of CD3+ CD4+ T cells in blood (A) and brain (B) of uninfected (day 0) and Plasmodium berghei ANKA (PbA)-infected (day 7) WT and Cyld−/− mice were determined by flow cytometry (n = 6 each), *p < 0.05 (two-tailed Student’s t-test) (C–F) Absolute (C) and representative relative (E) numbers of interferon (IFN)-γ-producing CD4+ T cells in blood and absolute (D) and representative relative (F) numbers of IFN-γ-producing CD4+ T cells in the brain from uninfected (day 0) and PbA-infected mice (day 7) after ex vivo restimulation with anti-CD3/CD28 (n = 6 each), *p < 0.05 (two-tailed Student’s t-test). Data from one of three independent experiments are shown.

