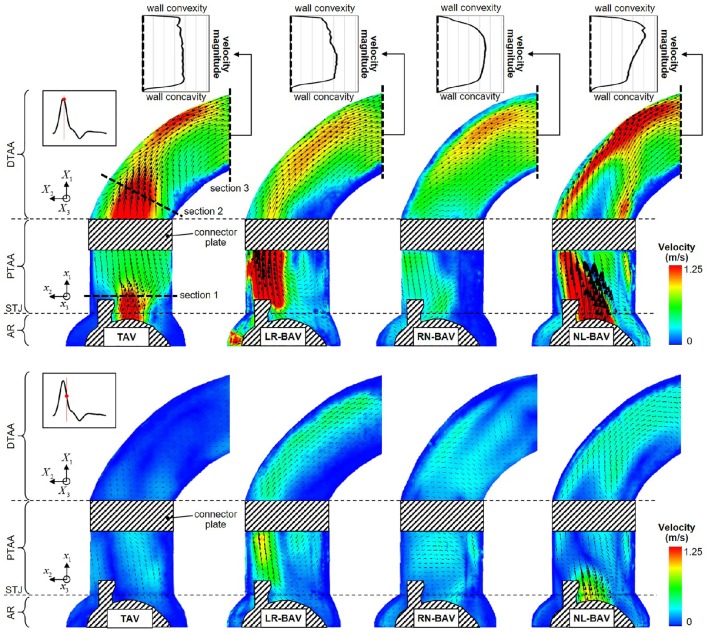
Figure 5.
Snapshots of the mean velocity fields generated by the four valve models at peak systole (top) and late systole (bottom), and peak-systolic velocity profiles measured across the outlet section of the aorta phantom (AR, aortic root; STJ, sinotubular junction; PTAA, proximal tubular ascending aorta; DTAA, distal tubular ascending aorta).

