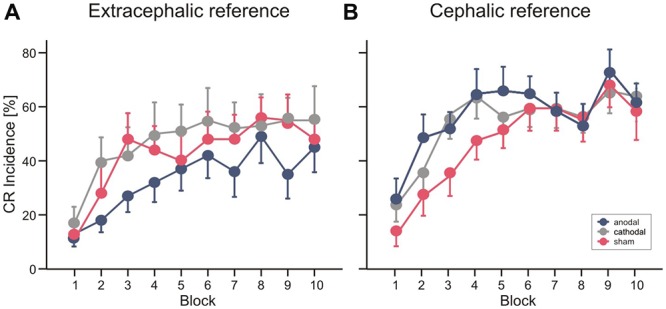
Figure 4.

Experiment 1 using an extracephalic reference (A) and Experiment 2 using a cephalic reference (B). Mean percentage conditioned response (CR) incidence and standard errors (SE) in paired trials shown per block of 10 trials during anodal (blue circles), sham (red circles) and cathodal tDCS (gray circles). See “Results” Section for further details.
