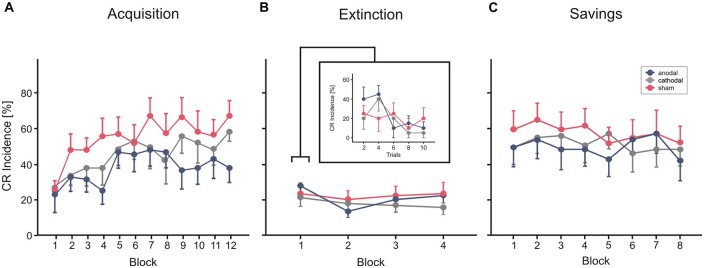
Figure 5.
Experiment 3 using a cephalic reference. Mean percentage CR incidence and SE in acquisition trials (A), extinction (B) and savings on the next day (C), shown per block of 10 trials. Anodal (blue circles), sham (red circles) and cathodal tDCS (gray circles) was applied during extinction trials. CR incidences in block 1 of extinction trials are shown more detailed in blocks of two trials. Decline of CRs across the four extinction blocks was not significantly different comparing stimulation groups. See “Results” Section for further details.

