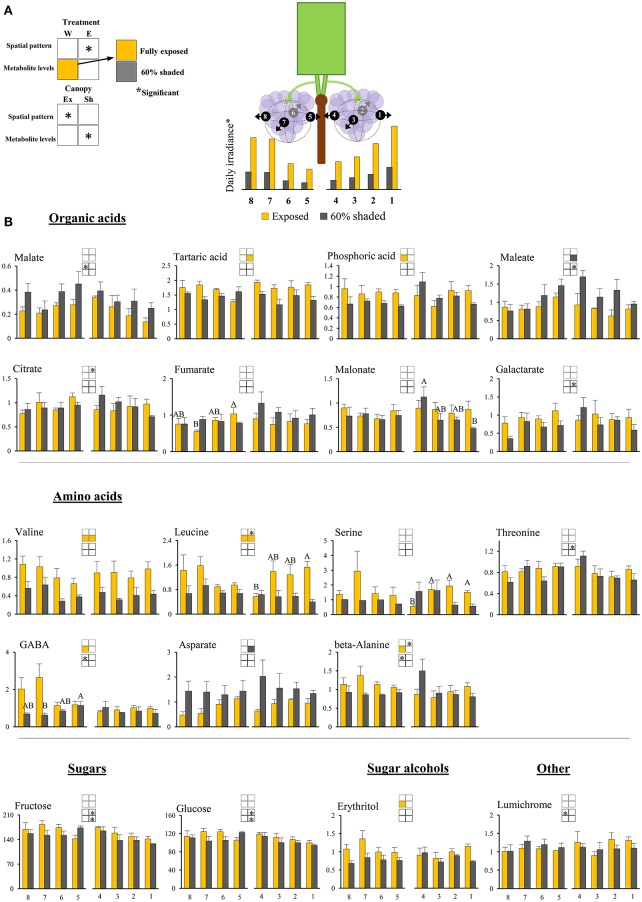
Figure 3.
Cluster spatial level results for primary metabolites detected by GC-MS in berry pulp tissues sampled from different cluster orientations and shading treatments. (A) Illustrations of the daily irradiance levels in each cluster orientation including estimations based on diffusive light measurements and the measured mean filtering capacity of the shading nets. (B) Organic acids, amino acids, sugars, sugar alcohols, and other compounds found to be significantly affected by SI levels, cluster position and/or cluster orientation. Levels represent relative abundance based on ion count. Numbers on the X axis represent cluster orientations. Yellow bars represent fully exposed clusters, and dark gray bars represent 60% shaded clusters. Error bars are standard error (n = 4). Bars of the same cluster location and treatment, marked by different letters, represent significantly different values (α < 0.05). Information given in the boxes details the significant effects of treatment (upper box) for clusters located on the east (E) and the west (W) side of the canopy, as well as canopy side (lower box), on the spatial pattern and profile levels of metabolite accumulation in fully exposed (Ex) and 60% shaded (Sh) clusters. Asterisks in upper box indicate a significant effect of treatment on the spatial pattern of compound accumulation. Yellow and gray boxes indicate a significantly higher overall compound level in the exposed and 60% shaded treatments, respectively. Asterisks in lower boxes indicate a significant effect of canopy side on the spatial pattern and overall compound levels.

