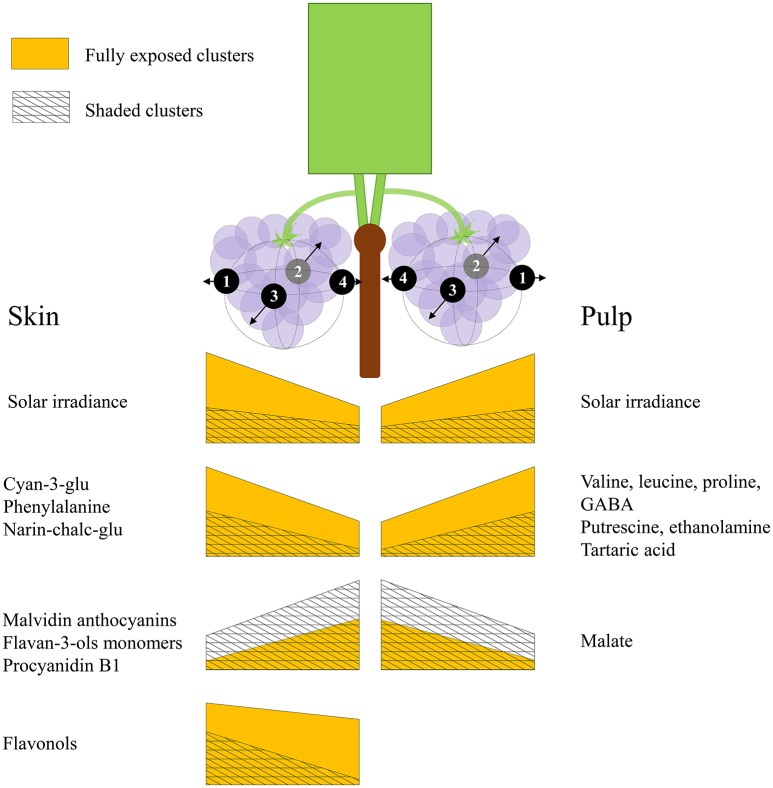
Figure 8.
An illustration summarizing the main findings of the study. Both sides of the canopy refer to the same cluster orientations (mirror image), the left side displays the results obtained for skin phenylpropanoids, and the right side for pulp primary metabolites. The trapezoid heights represent metabolite abundance and its pattern of change across the cluster, from internal to external orientations, corresponding with daily incoming SI. Yellow trapezoids represent fully exposed clusters, while mesh trapezoids represent 60% shaded clusters.

