Figure 1.
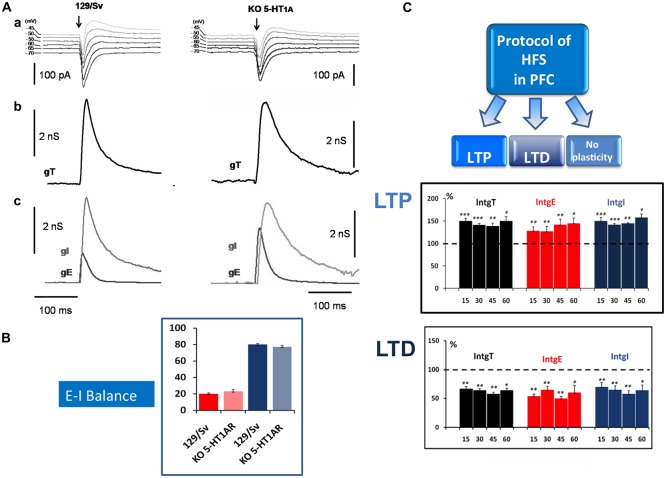
Determination of the Excitation-Inhibition balance (E-I balance) in the prefrontal cortex (PFC) and analysis of synaptic plasticity. (A) Brief description of the method to determine the E-I balance. (a) Representative current traces of synaptic responses (upper part) to layer 2–3 stimulation (arrow) recorded from a layer 5 pyramidal neuron (L5PyN) under voltage-clamp at various holding potentials in 129/Sv and KO 5-HT1A mice. (b) The second row represents the corresponding total conductance changes (gT) at the somatic level (for a complete description of the method, see Le Roux et al., 2006; Lucas-Meunier et al., 2009). (c) gT was then decomposed into its Excitatory (gE) and the Inhibitory (gI) components (third row). (B) The percentage of excitation and inhibition is expressed as the ratio of its integral value integrals of excitatory (IntgE) and inhibitory (IntgI) to the total conductance IntgT to determine the E-I balance. We observed a significant shift of the E-I balance towards more excitation between 129/Sv mice (20%–80%) and 5-HT1AR-KO mice (23%–77%; Meunier et al., 2013). (C) High frequency stimulation (HFS) protocol (Theta burst) in layer 2–3 of the PFC induced in L5PyNs, long term potentiation (LTP) or long term depression (LTD) or no plasticity of the responses. LTP (upper insert) was recorded 15 min, 30 min, 45 min and 60 min after the stimulation. Histograms represent relative changes (compared to the control before HFS: 100%) of IntgT, IntgE, IntgI. Synaptic conductances were determined under control conditions or after HFS protocol with a low frequency of stimulation (0.05 Hz). LTD (lower insert) was recorded in the same condition. *p < 0.05, **p < 0.01, ***p < 0.001.

