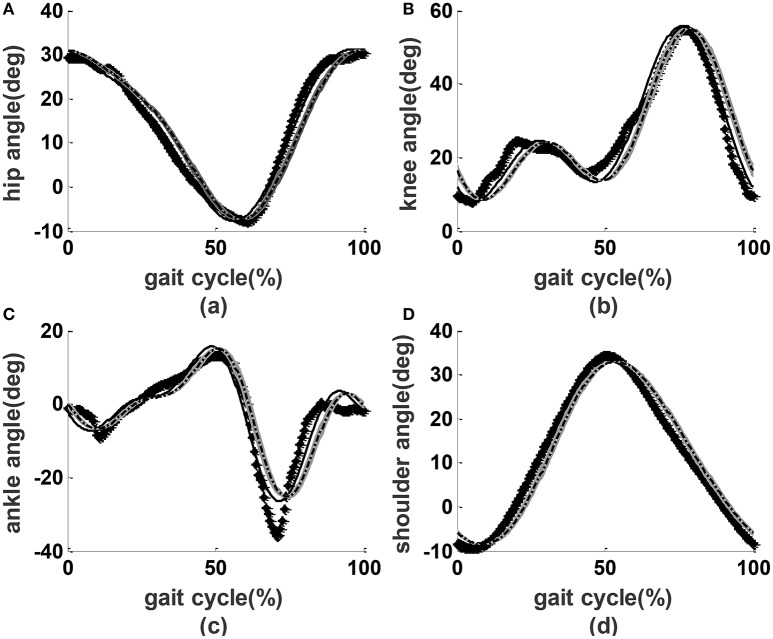
Figure 9.
Joint performance. Lines with diamonds: measured experimental values; dashed lines: reference values; solid lines: the encoder readings from the prototype without users; dash-dot lines with shading: the mean ± SD performance from the prototype with users. (A) Hip angles, (B) knee angles, (C) ankle angles, (D) shoulder angles.

