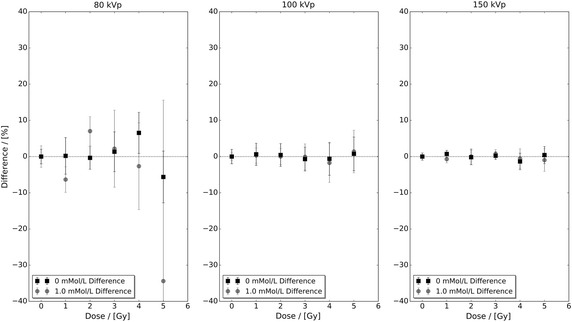
Fig. 3.

The percentage difference between the control and highest concentration experimental data sets with respect to their fitted linear-quadratic responses shown in Fig. 1. The observed level of difference in the 80 kVp data exceeds both the 100 and 150 kVp data
