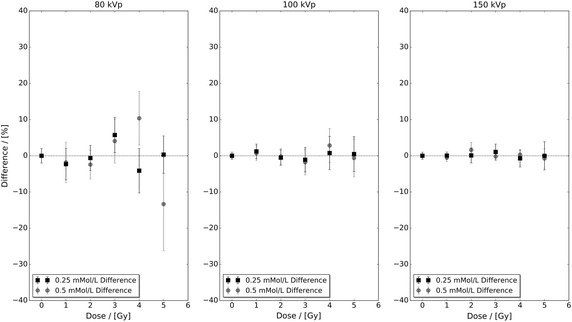
Fig. 4.

The percentage difference of the 0.25 and 0.5 mMol/L experimental data in Fig. 2 with respect to their fitted linear-quadratic responses obtained utilising the same protocols as Table 1. The level of difference in the 80 kVp data exceeds both the 100 and 150 kVp data as it did for the control and highest concentration experimental data sets seen in Fig. 3
