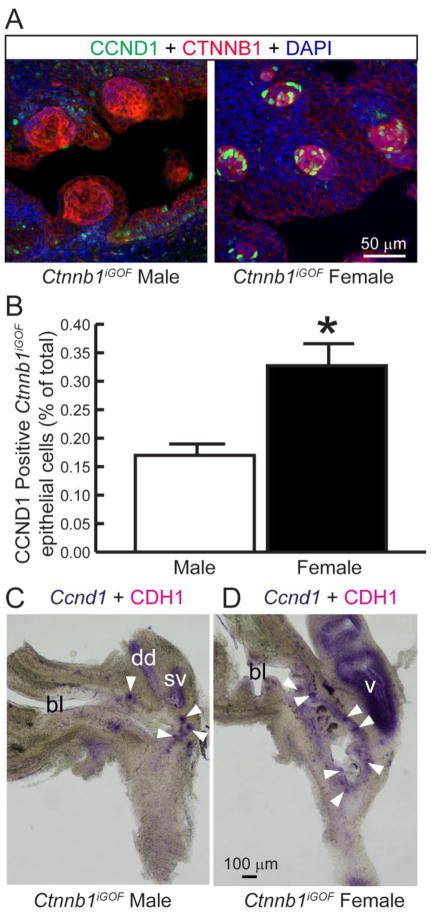
Figure 2. Ccnd1 mRNA expression is driven by CTNNB1 but CCND1 protein is more abundant in females than males.
Shh+/+; Ctnnb1tm1Mmt/tm1Mmt (control) and ShhcreERT2/+; Ctnnb1tm1Mmt/tm1Mmt (Ctnnb1iGOF) embryos were exposed to tamoxifen to stabilize CTNNB1 protein in islands of UGS epithelial cells. (A) 18 dpc UGS sections were immunofluorescently labeled to visualize CCND1 and CTNNB1. Staining patterns in each panel represent at least three embryos. (B) The CCND1 immunolabeling index was determined as the number of CCND1 immunopositive epithelial cells divided by the total number of epithelial cells within Ctnnb1iGOF epithelial cell islands. Results are the mean ± SE of three independent samples per group from at least three litters. Asterisks indicate significant differences between groups (p < 0.05). (C–D) 18 dpc Ctnnb1iGOF male and female UGSs were stained by ISH to visualize Ccnd1 mRNA (purple) and counterstained by IHC to visualize UGS epithelium marked by e-cadherin (CDH1). Arrowheads indicate GOF cell islands. bl: bladder, dd: ductus deferens, sv: seminal vesicle, v: vagina.

