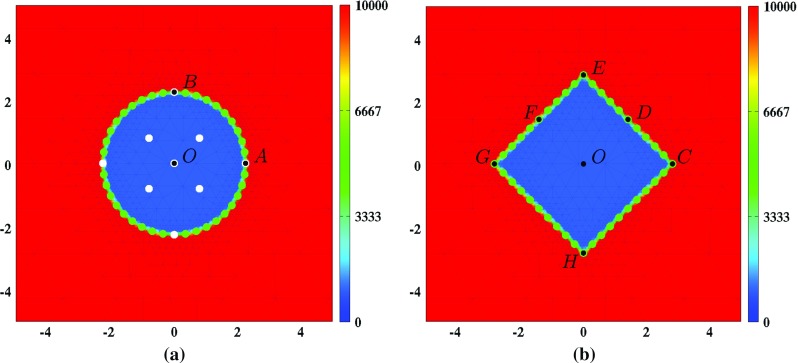
Fig. 1.

Graphical representations of the initial conditions. Depicted are in both subfigures, the initial shape of the wound and, in color scale, the initial cell density of the fibroblasts (). In both subfigures, the scale along both axes is in centimeters. a The white dots mark the material points where the evolution of the cell density/concentration of the individual modeled constituents was traced over time for the generation of some of the figures in Sect. 4. In both subfigures, the green dots mark the material points that were used to trace the evolution over time of the surface area of the wound. That is, at each time point, the area of the polygon with vertices located at the displaced green material points has been determined. Finally, the material points labeled with a letter have been used to study the evolution over time of the shape of the wound. See Sect. 4 for more details on this matter
