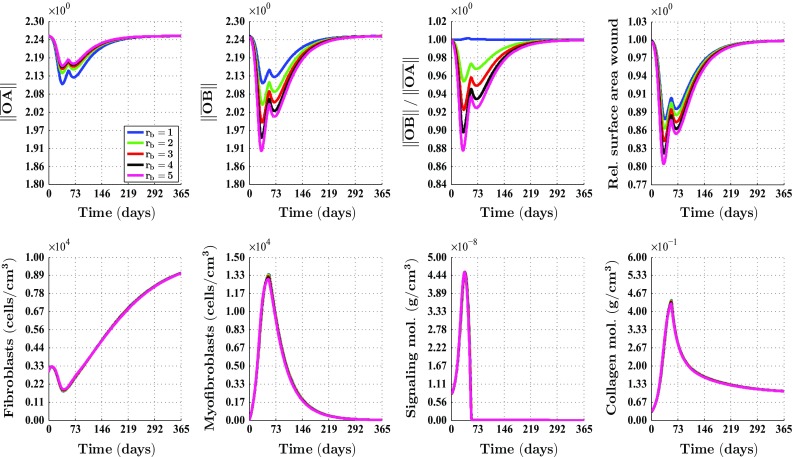
Fig. 3.

An overview of the healing response in the case of a circular wound, and different values for the ratio . The values for the remaining parameters are equal to those depicted in Table 1 in the appendix. See Fig. 1a for a depiction of the line segments and , and a depiction of where the cell densities and the concentrations of the modeled constituents were measured over time. The subfigures on the bottom row show the averages of these latter measurements. See also Fig. 1a for a depiction of how the surface area of the wound was measured over time. The legend displayed in the top-left subfigure applies to all subfigures. Due to the fact that the curves depicted in the subfigures on the bottom row are situated more or less on top of each other, most of them are hardly visible
