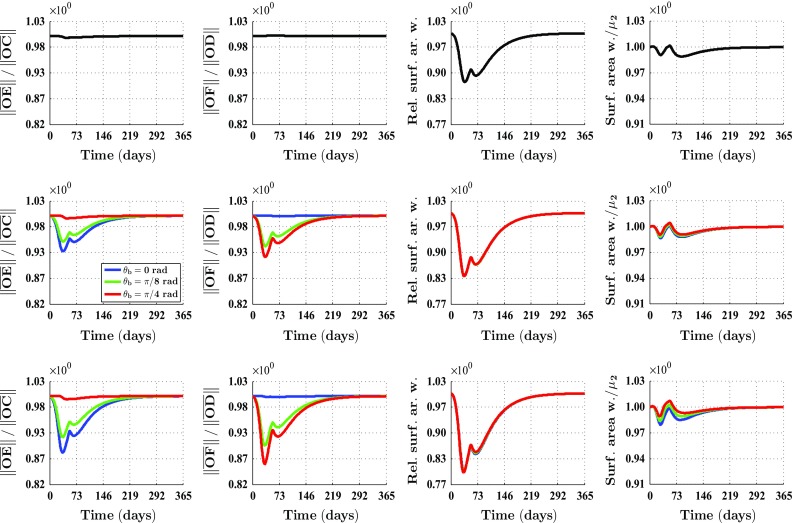
Fig. 4.

An overview of the healing response in the case of a square wound and different values for both the ratio and the angle . The values for the remaining parameters are equal to those depicted in Table 1 in the appendix. See Fig. 1b for a depiction of the line segments , , and . See also Fig. 1b for a depiction of how the surface area of the wound was measured over time. equals the surface area of the quadrilateral CEGH. See again Fig. 1b for a depiction of the vertices of this quadrilateral. The subfigures on the top row show overviews for and , the subfigures on the middle row show overviews for , and the subfigures on the bottom row show overviews for . The legend displayed in the middle row applies to all subfigures on the middle row and the bottom row. Due to the fact that the curves depicted in the subfigures related to the relative surface area of the wound are situated more or less on top of each other, solely one curve is mostly visible
