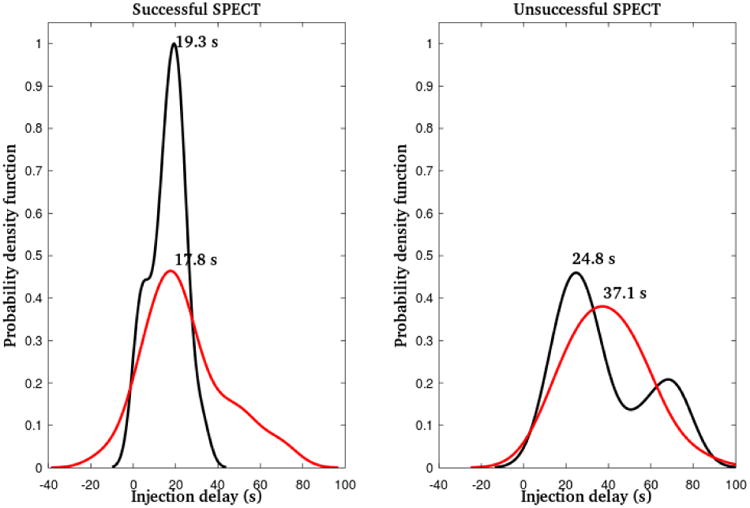
Figure 2.

Estimated injection delay distributions (probability density functions) for successful (left panel) and unsuccessful (right panel) ictal SPECT, separately for patients with nonlesional (black) and lesional (red) MRI. Injection delays at the peaks (global maxima) of these distributions are superimposed.
