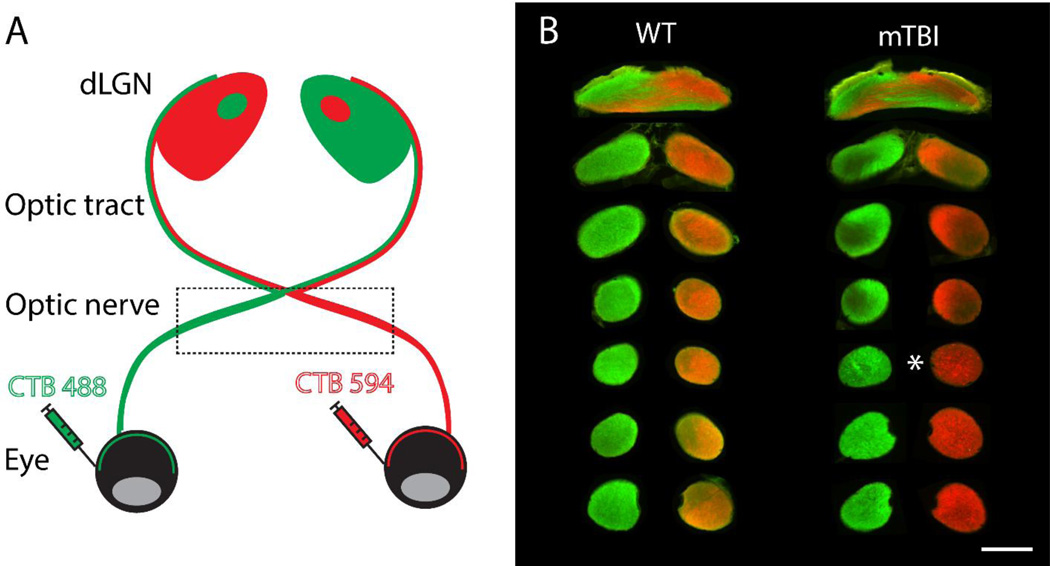
Figure 2.
Schematic representation of eye injections and visualization of tracer in the optic nerve. Recombinant cholera toxin β (CTB) conjugated to Alexa fluorescent dyes with two different excitation/emission profiles allow visualization of dLGN projections from the retinal ganglion cells labeled by eye injection of CTB. The projections outlined by the box in panel A are visualized in coronal sections of the optic nerve in panel B from uninjured mouse and 16 day post-injury mouse. Note the loss of fluorescent signal in mTBI sections downstream of the sections with bright puncta (marked with asterisk). Scale bar = 100 µm.

