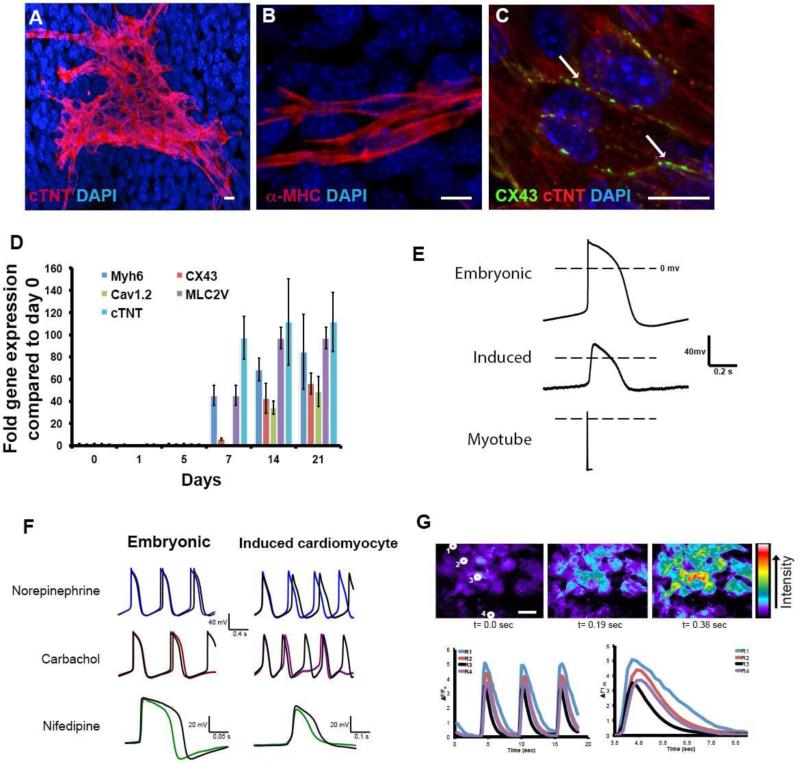
Fig.3. Characterization of induced cardiomyocytes.
A-C. Induced cardiomyocytes visualized by immunostaining at day 14 of culture. A. Cardiac troponin T (cTnT). B. α-myosin heavy chain. C. Connexin 43 showing gap junctions between adjacent cells D. Expression of five genes for cardiomyocyte terminal differentiation markers (qRT-PCR). Error bars indicate ± standard error of the mean. E. Typical spontaneous action potentials for E13.5 embryonic cardiomyocytes; induced cardiomyocyte; and evoked action potential for skeletal myotube. The duration of the induced cardiomyocyte action potentials is similar to those of the embryonic cardiomyocytes and much longer than those of the myotubes. F. Effects of norepinephrine, carbachol and nifedipine on spontaneous action potentials. Colored overlayed traces indicate spontaneous action potential after addition of each drug. G. Calcium transients in induced cardiomyocytes visualized with Fluo3AM. The traces indicate the signal for the four indicated cells, which are highly synchronized. Scale bar 20μm.All measurements were repeated several times as indicated, with standard errors, in the text.

