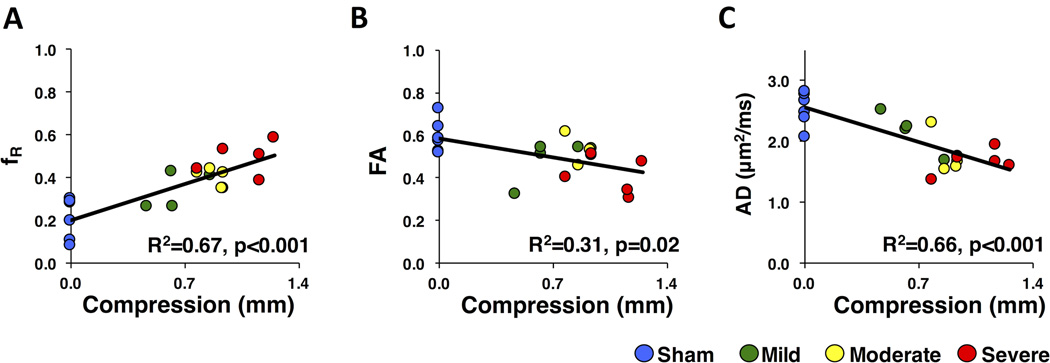
Figure 8. Linear Regression.
Scatter plots and the best-fit regression line including R2 and p-values are shown for DDE-PRESS restricted fraction (fR) (A), whole-cord DTI Fractional Anisotropy (FA) (B), and weighted DTI Axial Diffusivity (AD) (C), which are the best performing parameter from each model.

