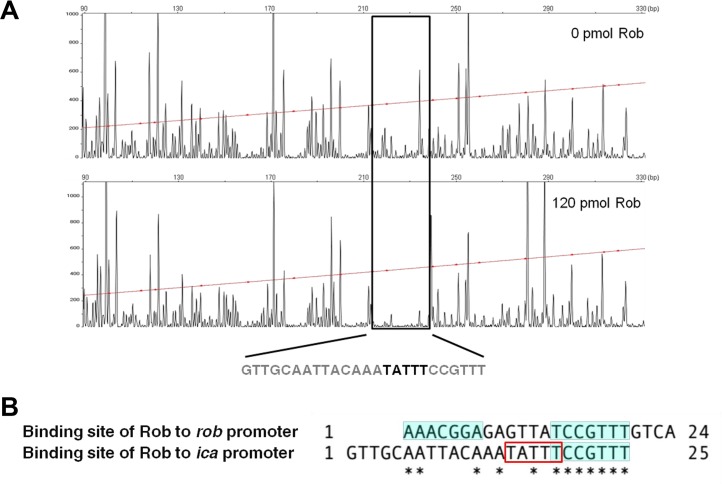
FIG 9 .
DNase I footprinting assay of Rob binding to the ica promoter region. (A) Footprint analysis of Rob binding to the ica promoter region. The sequence of the protected region is shown. (B) Comparison of the sites of Rob binding to the rob promoter region and ica promoter region. The palindromic sequence within the Rob-binding region is shaded. The bold letters (A) and rectangle (B) indicate the 5-bp TATTT motif.

