FIG 4 .

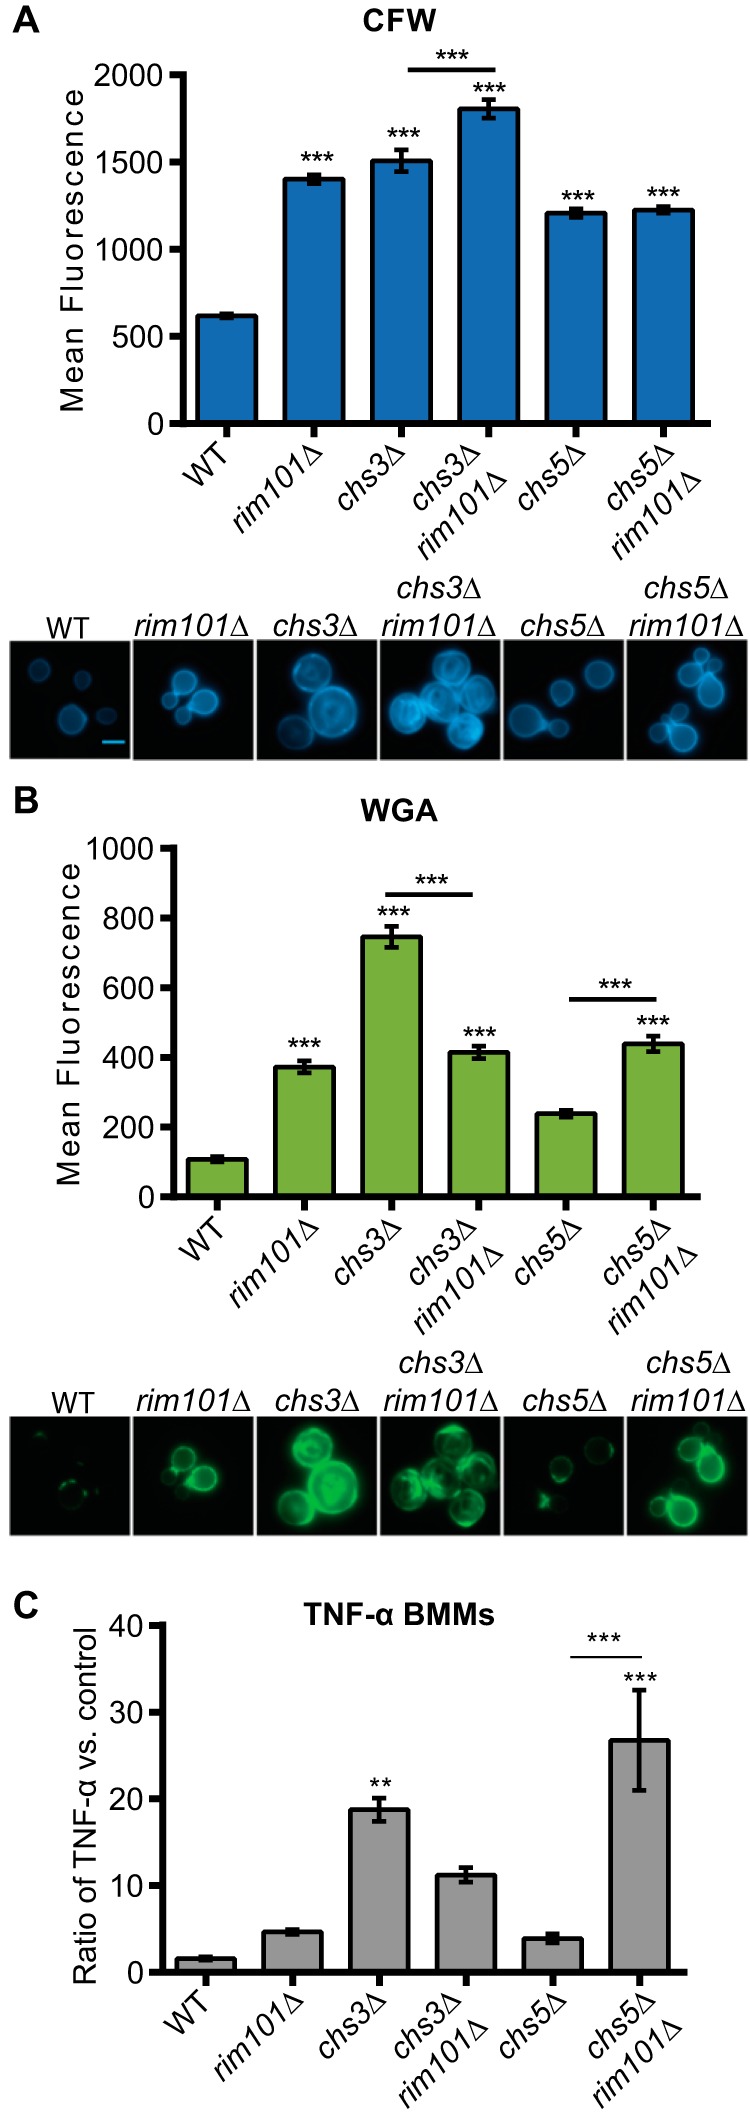
Fungal cell WGA staining intensity correlates with levels of induced TNF-α secretion from BMMs. (A and B) C. neoformans strains were stained with CFW (A) or FITC-WGA (B) after incubation in tissue culture medium at 37°C for 18 h. Fluorescence levels for 100 individual cells were quantified using ImageJ (Fiji) (upper panels) (n = 100). Representative fluorescent microscopic images for each strain (at a magnification of ×600) are demonstrated in the lower panels. (C) C. neoformans strains were coincubated with BMMs at a multiplicity of infection (MOI) of 10:1 C. neoformans/BMM cells. TNF-α levels in the culture medium were normalized to a control incubation with no added fungal cells. One-way ANOVA and Tukey’s multiple-comparison test were used to compare the means of results from three independent experimental samples. ***, P < 0.001; **, P < 0.01; *, P < 0.05. Error bars represent standard errors of the means.
