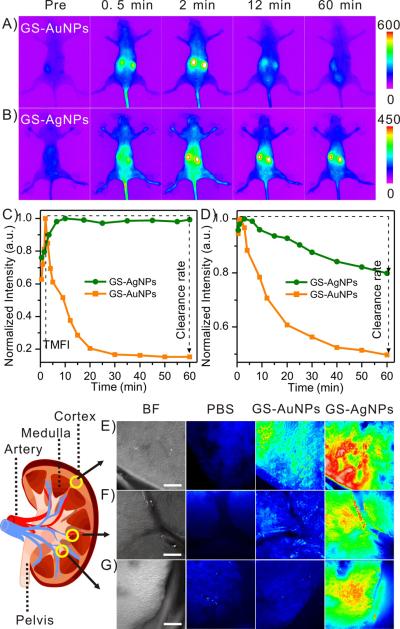
Figure 3.
Fluorescence imaging of renal clearance of GS-AuNPs and GS-AgNPs. A,B) Representative whole-body noninvasive fluorescence images of mice injected with the GS-AuNPs (A) and the GS-AgNPs (B) (Ex/Em filters: 710/830 nm). C,D) Representative time-fluorescence intensity curves (TFICs) of kidneys (C) and background (D) in the two groups of BALB/c mice (n=3) intravenously injected with GS-AuNPs and GS-AgNPs, respectively. Two parameters were extracted from the kidney TFICs: time to achieve maximum fluorescence intensity (TMFI) and clearance rate (defined as the clearance percentage at 60 min=[(peak value-intensity at 60 min) / peak value] × 100%). E–G) Kidney penetration study. Bright field (BF) and Fluorescence images of kidney slices after iv injection of PBS, GS-AuNPs and GS-AgNPs. Three representative regions were selected: cortex (E), medulla regions near the artery (F) and pelvis (G). scale bar=200 μm.

