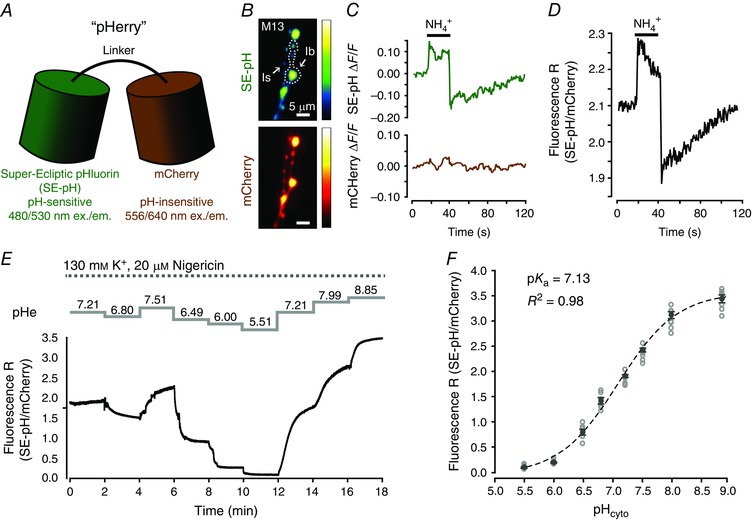
Figure 1. pHerry ratiometrically reports cytosolic pH of nerve terminals in situ .

A, schematic representation of the pHerry pH sensor. B, wide‐field epifluorescence images of the SE‐pH and mCherry components of pHerry expressed in the cytosol of M13‐Ib and MN13‐Is terminals. C, representative trace of the relative change in fluorescence (ΔF/F) of the SE‐pH and mCherry components of pHerry from MN13‐Ib terminals in response to a 20 s pulse of 20 mM NH4Cl. D, representative trace of the fluorescence ratio change of pHerry in response to a 20 s pulse of 20 mM NH4Cl in the same MN13‐Ib terminals as in C. E, representative trace of the changes in the pHerry fluorescence ratio from M13Ib terminals as the preparation was sequentially exposed to calibration solutions buffered to the indicated pH values in the presence of 20 μM nigericin and 130 mM K+. F, calibration curve of the pHerry fluorescence ratio to the imposed pHcyto values constructed from experiments in E. n = 7 larvae with each exposed to all eight pHcyto values. Open grey circles are individual measurements, black closed circles and bars are mean ± SEM. Black line is Boltzmann curve fit to the individual points in grey.
