
Figure 2. Enhanced acid extrusion following activity‐induced cytosolic acid transients follows a time course similar to that of synaptic vesicle membrane endocytosis.
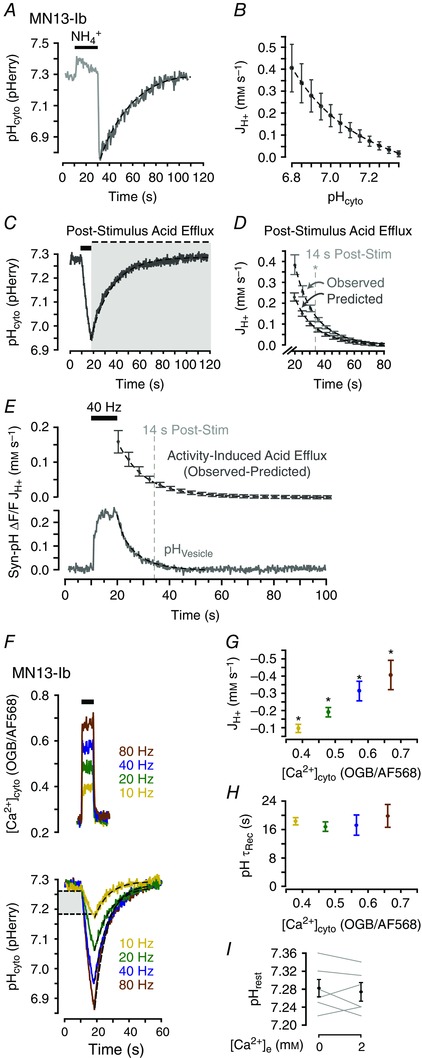
A, representative trace of pHcyto after a 20 s 40 mM NH4Cl pulse in MN13‐Ib terminals of w1118 larvae. B, net molar acid flux (JH+, mM s–1) after NH4Cl as a function of pHcyto. JH+ computed from the acid recovery phase (shown in A). Mean ± SEM, n = 6 larvae. C, representative trace of a nerve stimulation‐induced acid transient in MN13‐Ib terminals (40 Hz, 8 s). Grey box highlights post‐stimulus acid efflux. D, average JH+ every 1 s during the acid recovery phase (observed: recovery phase of pHcyto transients in C) and predicted intrinsic JH+ at mean pHcyto in each 1 s interval (calculated from B). Mean ± SEM, n = 6 larvae. Vertical line indicates time after stimulation at which values of observed and predicted flux are no longer significantly different (P > 0.050, unpaired Student's t test). E, activity‐induced JH+ (upper panel) following stimulation [calculated as (observed−predicted) acid flux in D]. Mean ± SEM, n = 6 larvae from D. Time course of endocytosis (lower panel, relative fluorescence change in Syn‐pH, average trace of n = 7 larvae). F, activity‐induced [Ca2+]cyto (representative traces) and pH (averaged traces, n = 6 larvae at each frequency) transients from 8 s action potential trains. Light grey box indicates the overlapping pHcyto range within which JH+ was calculated. G, quantification of mean JH+ during stimulation as a function of peak [Ca2+]cyto. Mean ± SEM, n = 6 larvae with values pooled by stimulation frequency and plotted to OGB/AF568 fluorescence ratio, * P < 0.050, repeated measures one‐way ANOVA with Holm–Sidak post hoc test. H, τrec of acid extrusion phase as a function of peak [Ca2+]cyto. Data plotted as in G; P > 0.050, repeated measures one‐way ANOVA. I, quantification of resting pHcyto before and after addition of 2 mm Ca2+ to Ca2+‐free HL3.1. Mean ± SEM. P > 0.050, paired Student's t test, n = 6 larvae. Dashed lines in A–C, E and F are single exponential curves.