
Figure 5. DVGLUT, NHEs and the vATPase all contribute to activity‐induced enhanced cytosolic acid efflux in presynaptic terminals.
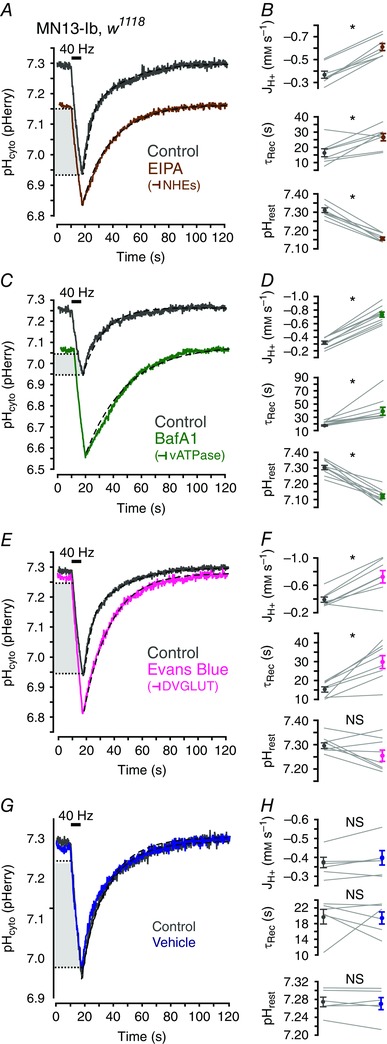
A, averaged traces of activity‐induced pHcyto transients in MN13‐Ib terminals of w1118 larvae before and after depletion stimulation in 50 μM EIPA (n = 9 larvae). B, paired quantification (from A) of mean JH+ during stimulation, τrec and resting pHcyto in w1118 larvae before and after incubation in EIPA. C–H, data collected and represented as in A and B with incubation in 1 μM BafA1 (n = 10), 10 μm EB (n = 8) and vehicle (n = 6) as indicated. See Table 1 for values. Stimulation (black bar) was 40 Hz for 8 s in A, C, E and G. Dashed lines are single exponential curves. Light grey box indicates the overlapping pHcyto range within which JH+ during stimulation was calculated. Data in B, D, F and H are plotted as mean ± SEM. * P < 0.050, paired Student's t test.