
Figure 7. DVGLUT displays Na+/H+‐exchange activity when expressed in Xenopus oocytes.
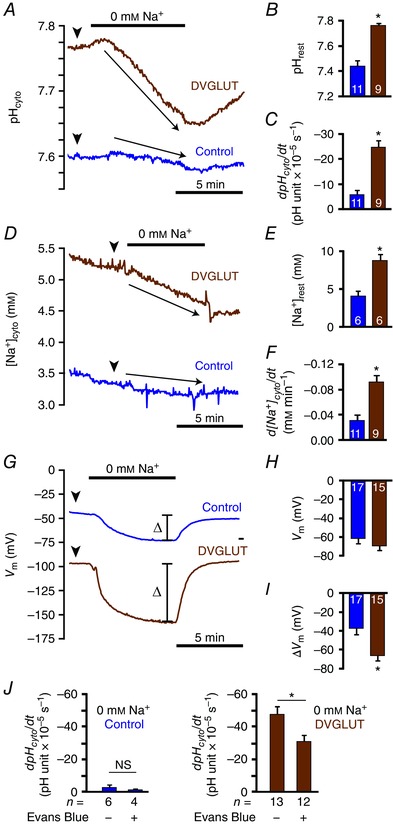
A, representative traces of pHcyto changes upon removal of Na+ in DVGLUT and control (water‐injected) oocytes. B, quantification of resting pHcyto (arrowheads in A) in DVGLUT (n = 9) and control (n = 11) oocytes. C, quantification of rate of pHcyto change (arrows in A) upon removal of Na+ in DVGLUT (n = 9) and control (n = 11) oocytes. D, representative traces of [Na+]cyto changes upon removal of Na+ in DVGLUT and control oocytes. E, quantification of resting [Na+]cyto (arrowheads in D) in DVGLUT (n = 6) and control (n = 6) oocytes. F, quantification of rate of [Na+]cyto change (arrows in D) upon removal of Na+ in DVGLUT (n = 9) and control (n = 11) oocytes. G, representative traces of V m changes following removal of Na+ in DVGLUT and control oocytes. H, quantification of resting V m (arrowheads in G) in DVGLUT (n = 15) and control (n = 17) oocytes. I, quantification of total change in V m (bars in G) upon removal of Na+ in DVGLUT (n = 15) and control (n = 17) oocytes. J, quantification of rate of pHcyto change upon removal of Na+ with and without incubation in 20 μm EB in DVGLUT (n = 12 treated, 13 untreated) and control (n = 4 treated, 6 untreated) oocytes. Mean ± SEM in B, C, E, F and H–J. * P < 0.050, unpaired Student's t test.