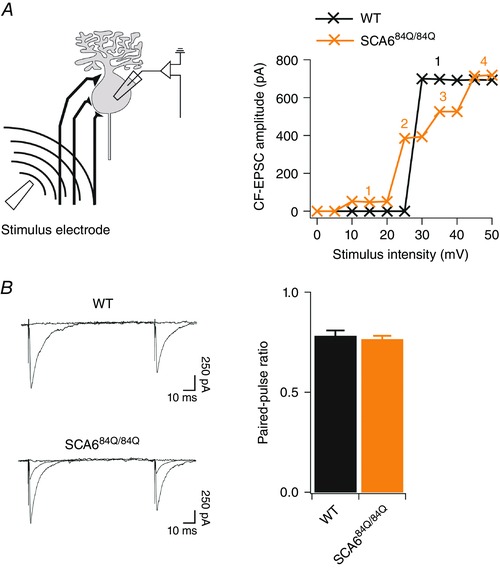
Figure 3. All‐or‐nothing climbing fibres display paired‐pulse depression.

A, left, schematic diagram showing recording configuration. A stimulation electrode was placed in the granule cell layer (∼50 μm from Purkinje cell layer) and climbing fibres were recruited by increasing the stimulation intensity (0–50 mV) parametrically while recording intracellularly from a nearby Purkinje cell. Right, example plots showing evoked EPSC amplitude over the range of stimulus intensity used. WT example (black) shows 1 all‐or‐nothing step in the EPSC response over a range of stimuli, while SCA684Q/84Q example cell (orange) has 4 discrete all‐or‐nothing steps in the EPSC response over the same range of stimulus intensity. B, left, sample recordings from WT (top) and overlaid sample recordings of two climbing fibres in SCA684Q/84Q (bottom) Purkinje cells showing similar degrees of paired‐pulse depression at the climbing fibre synapse in both genotypes. Right, the paired‐pulse ratio, or EPSC2 amplitude/EPSC1 amplitude, is similar in WT (black) and SCA684Q/84Q (orange) Purkinje cells (WT: PPR = 0.78 ± 0.03, n = 4; SCA684Q/84Q: PPR = 0.77 ± 0.02, n = 9; not significantly different, P = 0.59).
