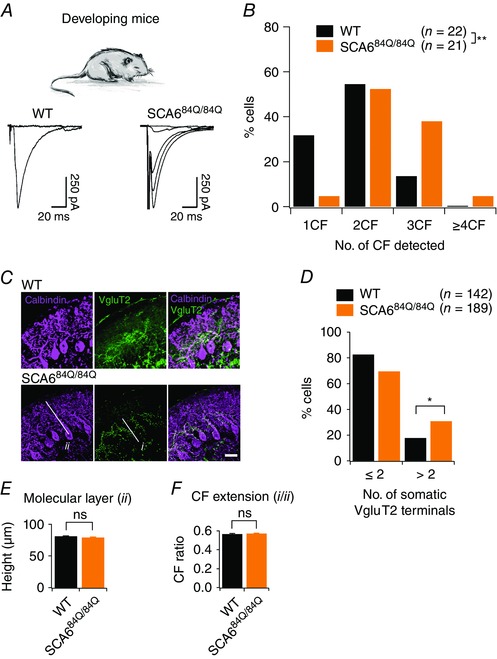
Figure 4. Persistent multiple climbing fibre innervation onto Purkinje cells of SCA684Q/84Q mice observed during the second postnatal week of development.

A, top, experiments conducted in P10–13 developing WT and SCA684Q/84Q mice. Bottom, example traces showing climbing fibre innervation from P11 WT mice (left, a maximum of 1 climbing fibre was elicited with extracellular stimulation) and from P12 SCA684Q/84Q mice (right, 4 all‐or‐nothing climbing fibres were elicited with extracellular stimulation). B, histogram showing distribution of Purkinje cells that are innervated by 1, 2, 3, or more climbing fibres (CF) from WT (black) and SCA684Q/84Q (orange) mice. Distribution is significantly shifted to Purkinje cells with higher numbers of climbing fibres at this age in SCA684Q/84Q mice (significantly different, Mann–Whitney U test, P = 0.0063). No other significant differences in EPSC properties were observed (see Table 1). C, representative images show immunocytochemistry labelling of calbindin (purple) and the transporter VGluT2 that is enriched at climbing fibre synapses (green) in P10 WT (top) and SCA684Q/84Q cerebellar slices. D, bar graph showing the number of Purkinje cells with somatic VGluT2 puncta for WT (black) and SCA684Q/84Q (orange) mice. More SCA684Q/84Q Purkinje cells display higher numbers of somatic VGluT2 puncta than WT (significantly different, Student's t test, P = 0.01). E and F, changes in the height of the molecular layer (E; indicated as ii in image in C; WT: 80.81 ± 0.98, n = 3 mice; SCA684Q/84Q: 78.89 ± 1.18, n = 4 mice, not significantly different, Student's t test, P = 0.21) and climbing fibre (CF) extension, the extent of the molecular layer innervated by climbing fibres (F; i/ii in image in C; WT: 0.56 ± 0.01, n = 3 mice; SCA684Q/84Q: 0.57 ± 0.01, n = 4 mice, not significantly different, Student's t test, P = 0.61) are unchanged in SCA684Q/84Q mice, arguing that multiple innervation arises due to the retention of somatic synapses. *P < 0.05; **P < 0.001.
