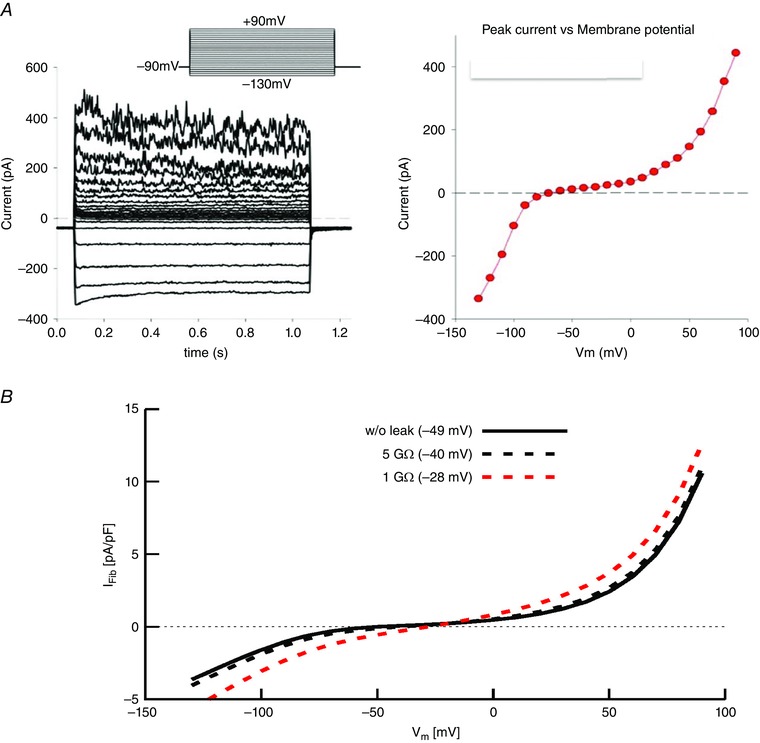
Figure 1. Current–voltage relations of a patch‐clamped human synovial fibroblast.

A, representative patch clamp recordings from a single human synovial fibroblast that had been in conventional 2‐D cell culture for approximately 3 days. From an apparent resting membrane potential of approx. −40 mV, this cell was clamped to a holding potential of −90 mV and then 1 s rectangular voltage command steps were applied in 10 mV increments in the range of −140 to +100 mV. Distinct inward K+ currents are activated by hyperpolarization; in addition, at least two different K+ currents are activated positive to approx. 0 mV. The isochronal I–V relation on the right summarizes this information (W. R. Giles & R. B. Clark, unpublished observations). B, analyses of the effects of changes in patch microelectrode seal resistance on the apparent resting potential of a single enzymatically isolated human synovial fibroblast. Three simulated N‐shaped I–V relationships are superimposed. The I–V relationship denoted by the black continuous line has been fitted to the experimental isochronal I–V data from 6 fibroblasts. Assuming that the patch electrode can form a ‘perfect’ seal, an apparent resting membrane potential of −49 mV is obtained. The data represented by dashed lines illustrate the changes in I–V curve shape and resting potentials when a linear leakage current (seal leakage) is added, assuming either a 1 GΩ (dashed red line) or 5 GΩ seal resistance (dashed black line) is introduced. As shown in the inset, the ‘seal leak’ depolarizes the ‘zero current membrane potential’ or apparent resting potential to approx. −40 mV (5 GΩ) or −28 mV (1 GΩ) from the value obtained with an infinite seal resistance –49 mV.
