
Figure 1. After 2 h of hypoxia, regional CBF is seen to vary compared to normoxia with increases (red) and decreases (blue) in CBF seen.
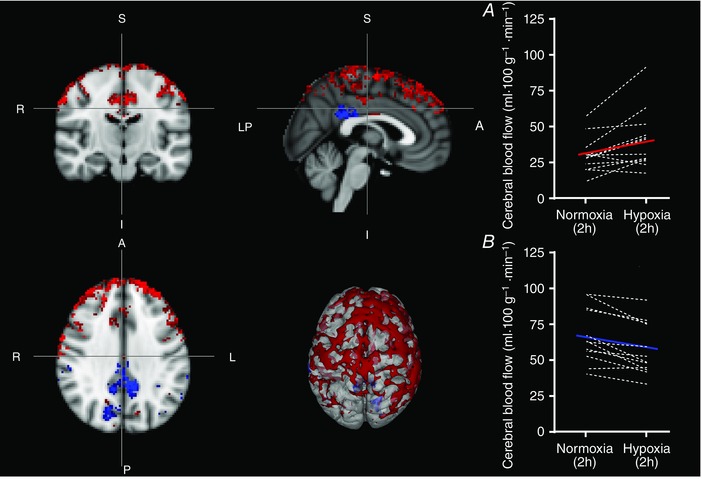
Significant clusters (cluster based correction: P < 0.01) in the frontal pole, middle frontal gyrus, anterior division of the cingulate gyrus, superior frontal gyrus and precentral gyrus, amongst others, showed expected increases in CBF (absolute CBF values in A), whereas unexpected decreases in regional CBF (absolute CBF values in B) were seen not only predominantly in the posterior cingulate gyrus, but also in the cuneal cortex and the supramarginal gyrus (uncorrected voxel‐wise: P < 0.05, improving the display of the regions exhibiting changes in CBF).