Figure 2.
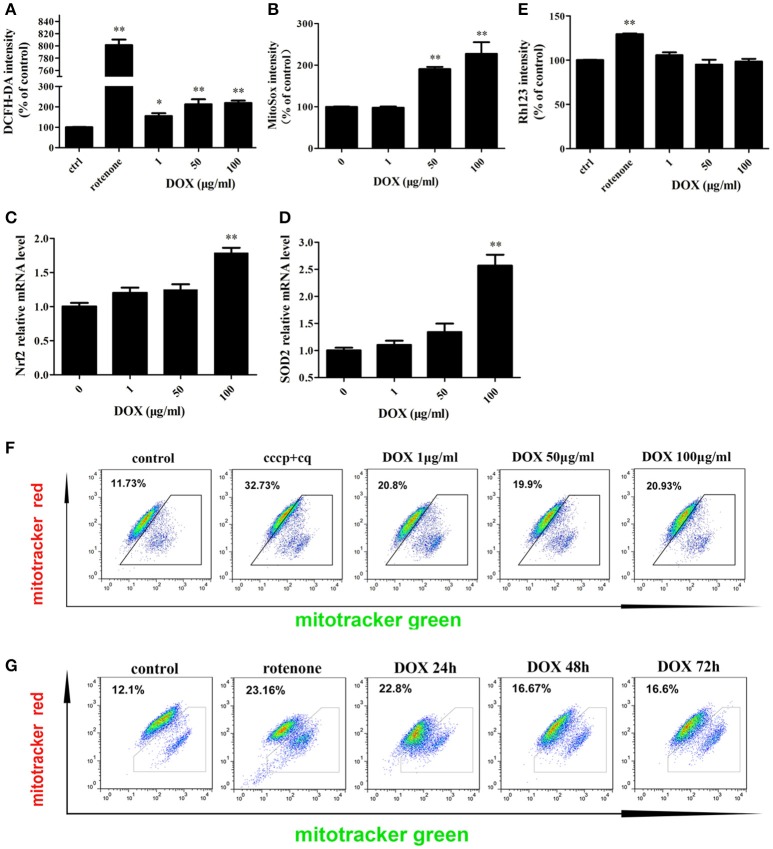
Effects of DOX on IPEC-J2 cell mitochondria. (A,B) IPEC-J2 cells were treated with DOX for 24 h. Rotenone (100 μM) was as a positive control. Reactive oxygen species (ROS) and mitoROS levels in cells were detected by DCFH-DA or MitoSox fluorescent probes, respectively, and quantified by flow cytometry (FACS). (C,D) Nrf2 and superoxide dismutase (SOD)2 mRNA expression levels were normalized relative to the control. (E) IPEC-J2 cells were treated as in A, harvested, stained with Rhodamine 123, and subjected to FACS to examine mitochondrial membrane potential. Mean intensities were normalized relative to the control. (F) IPEC-J2 cells were treated as A, (G) 50 μg/ml DOX treatment 24, 48, and 72 h, the cells were harvested and stained with MitoTracker Green and MitoTracker Red. Contour plots of the FACS analysis are depicted. The proportion of dysfunctional mitochondria was calculated from three independent experiments as 100% × [(green stained mitochondria) − (red-stained mitochondria)]/(green-stained mitochondria). Data are means ± standard deviations of three independent experiments. One-way analysis of variance; *P < 0.01; **P < 0.001.

