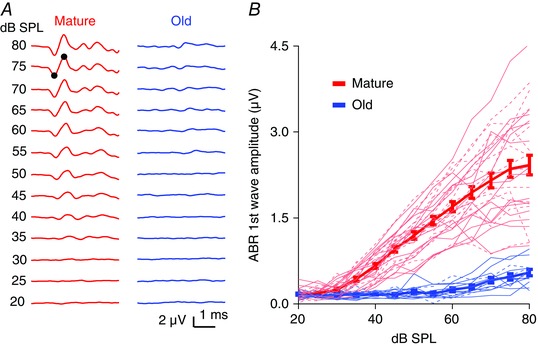
Figure 1. CBA/CaJ mice show ARHL.

A, example ABR waveforms recorded from mature and old mice in response to clicks. Black dots mark the rising phase and peak of the first wave. B, growth curve of the ABR first wave amplitude for increasing click intensity. Thick lines are averages of all mice in each group (error bars are SEM). Thin lines show individual mice; continuous lines: female; dashed lines: male.
